
Whether you are trying to see where your business is or where you need to be, there are many types of KPIs you need to track when it comes to your distribution company.
Data is a good thing for all distributors, but when it comes to improving your business performance, having too much data can be even worse than not having enough. You’ll be so buried in the data and reports that you’ll miss the most important indicators of your business health.
That’s where Key Performance Indicators (KPIs) can make or break a business. With proper distribution KPIs you get a clearer picture of your business with less effort. These measurements, when designed for your business, can be used to improve performance and results. Thousands of measurements have been defined over the year including many “common” measurements that virtually every distributor can use:
- Profit and Loss
- Profitability by Customer
- Cash Flow
- Inventory Turns
- On Time Shipping
- And more
What can KPIs do for my distribution business?
It depends on your focus and priorities. KPIs vary from business to business. You may want to include historical KPIs, described below, to give you a heads up around any anomalies that could be errors or fraud.
Historical and Predictive KPIs
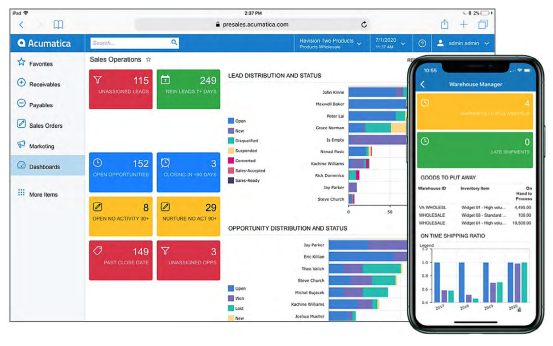
KPIs can be tailored to track your overall distribution business status and performance telling you where you’ve been and where you are headed.
|
|
Historical KPIs can be set up with alerts and warnings that monitor and detect exceptions, calling attention to issues or “push” alert messages sent via email or text.
On the other hand, predictive KPIs can make it easier to see where you may be heading at a glance. Leveraging internal and external data, these can help you order smarter and plan ahead. Predictive KPIs for distribution may use economic indicators, demographic trends, or specific industry indicators.
|
KPIs can also be set up to target specific areas of your business. Distributors find it hard to pinpoint problems in their processes without these sorts of pictures. Every area of the distribution network can be watched individually or in combinations across multiple factors. Having visuals into areas like inventory, on-time shipments, profitability, etc. for a single warehouse or leg of the supply chain or other groupings or categories can make you successful.
What every distribution business should be tracking:
When it comes to your distribution firm, you need to know, in real-time, which items are being ordered, how fast each item is being shipped, and which items are profitable. Without that insight, there’s no way you will stay competitive now days.
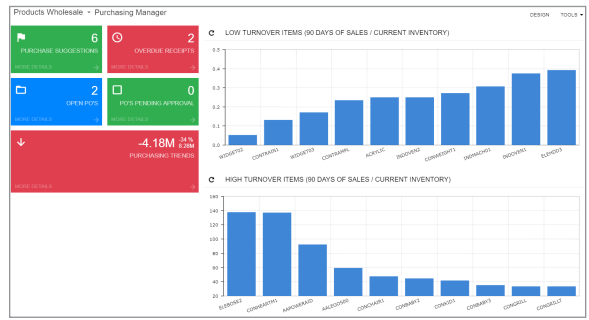
- Inventory turnover ratio: Quickly and visually see low turnover items and high turnover items while watching open POs and purchasing trends.
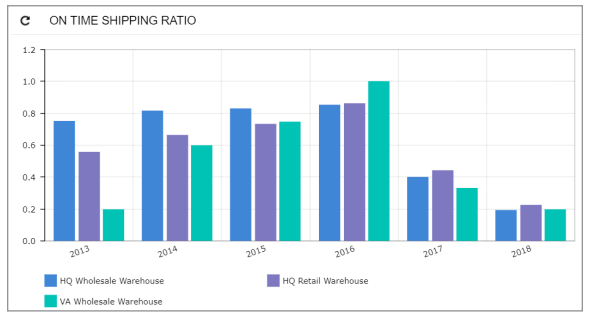
- On-time shipping ratio: This simple chart compares different warehouses on shipping metrics and trends. Analysts have a starting point to eliminate individual warehouse concerns and drill down into industry patterns.
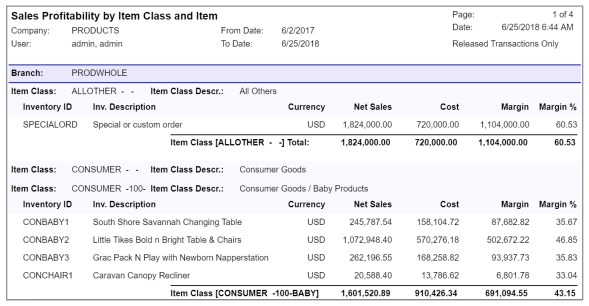
- Profitability by item: This example of Sales and Profitability by Item illustrates the power of a KPI. Having the ability to sort and summarize masses of data to give you business insights is instrumental in making good decisions.
Give your business an advantage over competitors who are drowning in meaningless data. Learn more about which KPIs you need to track for your distribution business. Download the Acumatica-Whitepaper-KPIs-for-Distribution now.
Parallel Solutions has been helping distribution organizations since 1995. Have a question for our distribution experts? Call us at 440-498-9920 or email us at sales@parallelsolutions4u.com.
Also read:
5 Steps to Modernize Your Distribution Operations