

Metrics are everywhere in manufacturing organizations, from accounting to sales, and quality to production. Monitoring data helps manufacturers increase sales, improve product quality, reduce costs, fend off competitors, develop innovative products and services, and overall, gives you vital insights into your operational efficiency.
Common Mistakes
However, good metrics only work if you have accurate, complete and timely data. Unfortunately, manufacturers often have indicators that are not real-time measurements, which leads to problems that get out of hand. In addition, many businesses focus on internal issues and neglect to compare themselves against industry peers. Make sure you don’t fall prey to these pitfalls in your analytics.
- Bad Data
- Lack of Strategic Alignment
- Lagging vs. Leading Indicators
- Missing Peer Analytics
Metric Types
Use descriptive analytics to identify lagging indicators to understand what happened in the past. Expand into diagnostic analytics to determine why things happened and predictive analytics to recognize when they might happen again. Prescriptive analytics help to avoid issues before they occur. Advances in technology have created a fifth metric category–cognitive analytics. These are artificial intelligence driven, with machine learning, and they improve the quality of your metrics and automate procedures to mitigate issues without human intervention.
Metrics for Manufacturers
Financial Metrics
Manufacturing requires strong financial metrics to ensure success. Knowing the key financial metrics and understanding how they work together can provide companies with a better chance of achieving their goals. Here’s an overview of some of the most important financial metrics for manufacturers today.
Revenue Growth & Cash Flow
Revenue growth provides a good snapshot of how a company is doing year over year, and it’s often one of the most closely watched figures in manufacturing. Companies should pay close attention to cash flow as well. It helps them understand their short-term liquidity and gives them insight into how quickly they’re able to turn around investments from customers or suppliers into cash.
Gross Margin
Gross margin is the ratio between total revenue and total costs per unit (including direct labor, raw materials, overhead). A higher gross margin means higher profits for manufacturers, which can be used to cover expenses like capital improvements or paying down debt. Gross margin also shows whether a product line is healthy; when it starts to drop, it can indicate pricing problems or production inefficiencies that require immediate attention.
Unit Cost Variance
Manufacturers measure their unit cost variance by comparing the actual cost incurred producing one unit vs what was budgeted before it went into production. Ideally you want this variance figure to stay within a given range over time so that you know you can remain competitive on price without sacrificing quality or scalability in production. The closer your actual unit costs come to your budgeted setpoint on average, the more efficient your manufacturing process will be overall.
Operational Metrics

Operational metrics are the measurements used to assess how successful a manufacturing process is. They help manufacturers identify where improvements and optimizations can be made to keep up with increasing customer demand, competition, and market trends. Here are some of the most important operational metrics that manufacturers should track:
Inventory Turnover Ratio
Having accurate inventory records is essential for any successful manufacturer. Knowing how many units are on hand vs what has been sold over a certain period gives companies insights into areas such as supply chain performance and customer service effectiveness. The inventory turnover ratio measures how frequently stock is being used up through sales during a given period versus accumulating as excess relative to demand; higher numbers mean that there are fewer deadstock items sitting idle at any given point in time which translates into less money spent stocking unwanted products in warehouses instead of earning back its value through sales activity elsewhere in the marketplace.
Manufacturing Cycle Efficiency (MCE)
MCE measures the amount of time taken for a product to move through each stage of the manufacturing process, from raw material processing, production, testing and quality control all the way through packaging, shipping and delivery. It measures efficiency levels throughout the entire process — from materials sourcing to customer acceptance.
Lead Time Metrics
In manufacturing, lead time refers to the amount of time between the customer’s order and when their product is shipped. Lead time has both an operational component (the actual physical production process) and a logistics component (wasted resources tracking inventory availability). Knowing how long it takes from order to delivery can help an organization understand which components of the production process require more attention or efficiency.

Cycle Time Metrics
Cycle time measures the amount of elapsed time for a single part or assembly pass through production before completion. This metric helps identify areas where customization processes are inefficient, allowing teams to find solutions proactively rather than reactively. It also provides insights into inventory control costs by exposing any excessive holding or backordering problems that may exist in the supply chain.
Capacity Utilization Metrics
Fabrication capacity utilization is one of the most essential metrics in manufacturing operations and helps to determine whether an organization is producing enough parts quickly enough to meet customer orders. It enables teams to adjust production schedules when there are changes in demand and optimize resources accordingly, as well as anticipate potential bottle-necks due to increasing throughput demands on existing equipment/resources.
Waste Reduction Metrics
Reducing waste is one of the primary objectives for most organizations seeking improved efficiency and cost controls in their manufacturing processes. Waste reduction metrics allow analyzing important factors such as defects per million parts produced, scrap rate percentage per unit produced, changeover times between jobs, unplanned downtime due to equipment failure or unscheduled maintenance, etc., giving teams visibility into areas for improvement along with tangible goals for reducing waste output over time.
Material Inventory Accuracy Metrics
Having ready access to accurate material inventories helps ensure smooth manufacturing operations by ensuring that materials aren’t in short supply and preventing delays due to missing parts. Investing in quality assurance practices like vendor evaluations and spot checks can help organizations reduce errors while improving overall accuracy levels across multiple sources throughout the supply chain network – resulting in fewer surprises during production runs and less money wasted on overly expensive supplies purchased “just-in-case.”
Parallel Solutions & Acumatica
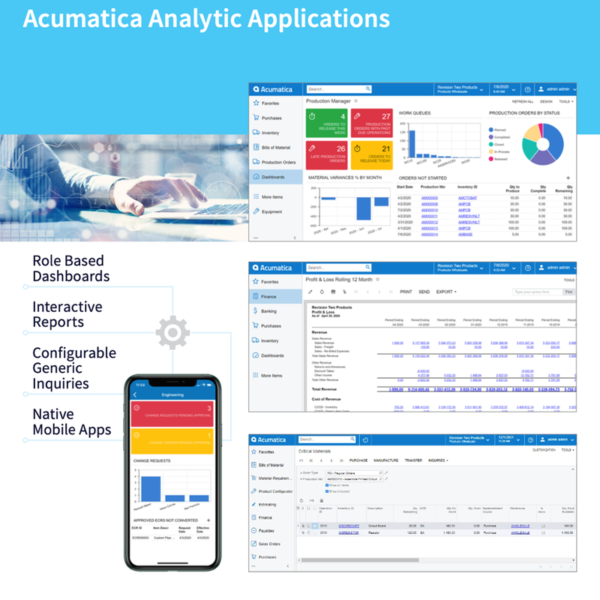
No matter your manufacturing specialization, or where you are in your growth plan, metrics can help get your business to where it wants to be. Parallel Solutions has helped hundreds of manufacturers. Our experienced consultants specialize in Enterprise Resource Planning (ERP) for the Distribution and Manufacturing industry. With supply chains becoming more complex every day and new economic pressures, choosing the right ERP solution and the right partner to deploy it has never been more critical. For example, many of our SMB manufacturing clients use Acumatica ERP, getting an enterprise level system, with enterprise tools, at an SMB-level price, including dashboards, KPIs, interactive reports, configurable and flexible inquiries, mobile access and more. Acumatica is built on a future-proof cloud platform with native artificial intelligence and machine learning, Acumatica provides unparalleled manufacturing depth with robust financials, native customer relationship management, and powerful business intelligence applications.
“We love Acumatica’s dashboards. We are in the process of integrating Microsoft’s Power BI to pull information for our sales team reports to send to our distributor agencies, and the overall transparency of Acumatica has been very helpful to me.” – SHIVANI RAVAL, DIRECTOR OF OPERATIONS FIDELUX
Learn more – download this free manufacturing whitepaper and read about how to develop actionable manufacturing metrics for sustainable growth and streamlined operations. Then let’s talk. Call us at (440) 498-9920 or email us at sales@parallelsolutions4u.com.
Parallel Solutions is the expert in helping manufacturing businesses just like yours.