
Last Updated: February 23, 2026
When you walk into your office on Monday morning, you need answers fast: Which customer orders are running late? What’s your current cash position? Which production orders are behind schedule? Are any customers over their credit limit?
For most manufacturers, getting those answers means logging into multiple systems, running reports, and piecing together data from spreadsheets — by which point your first meeting has already started.
Acumatica solves this with role-based dashboards and powerful generic inquiries that surface critical information the moment you log in. This guide explains how these tools transform daily operations for manufacturers — from reactive firefighting to proactive, data-driven management.
Browser-Based Access: Work From Anywhere, On Any Device
Acumatica runs entirely in a web browser — Chrome, Edge, Safari, or Firefox — with no client software to install or maintain. Users can access the same live system from an office desktop, home laptop, customer site tablet, or smartphone.
Over 90% of Acumatica customers choose cloud hosting, where Acumatica manages security, backups, and infrastructure. On-premise deployment is also available. Either way, the user experience is identical. Dedicated iOS and Android mobile apps are available for on-the-go tasks like approving purchase orders, checking inventory, or reviewing dashboards.
Role-Based Security and Personalization: Everyone Sees What They Need
Acumatica’s role-based security controls not just what users can do, but what they see. The production manager sees manufacturing dashboards and production order menus. The controller sees financial dashboards and accounting screens. The sales rep sees customer data and order management.
This security model also governs multi-company access, controlling which business units each user can view. The goal is clarity: reduce clutter, reduce errors, and help each person focus on what matters to their role.
Interactive Acumatica Dashboards: Your Business Command Center
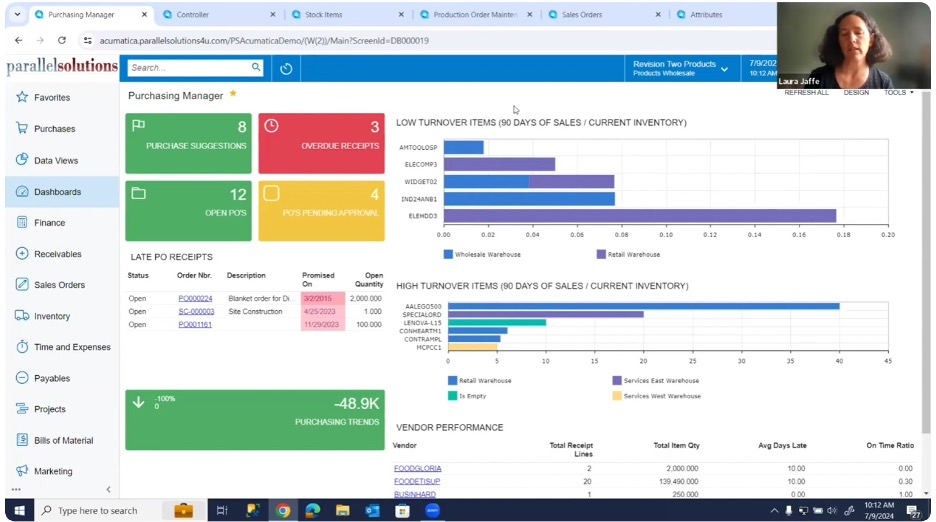
Acumatica includes dozens of pre-built dashboards for purchasing managers, controllers, sales reps, warehouse managers, and production supervisors. Each dashboard displays configurable widgets — charts, KPI metrics, alert lists, and trend graphs — tailored to the role.
Key dashboard capabilities include:
- Drill-down capability: Every widget is clickable. Click “14 overdue customers” to see exactly which customers are overdue and by how much.
- Color coding: Red for items needing immediate action, yellow for approaching thresholds, green for on-track items.
- Filtering and grouping: Click legends to filter data on the fly — show only one warehouse, hide others — without leaving the screen.
- Full customization: Admins can create new dashboards, add widgets, modify layouts, and share configurations. Individual users can also personalize their own dashboards.
The Customer 360 Dashboard: Complete Customer Visibility in One View
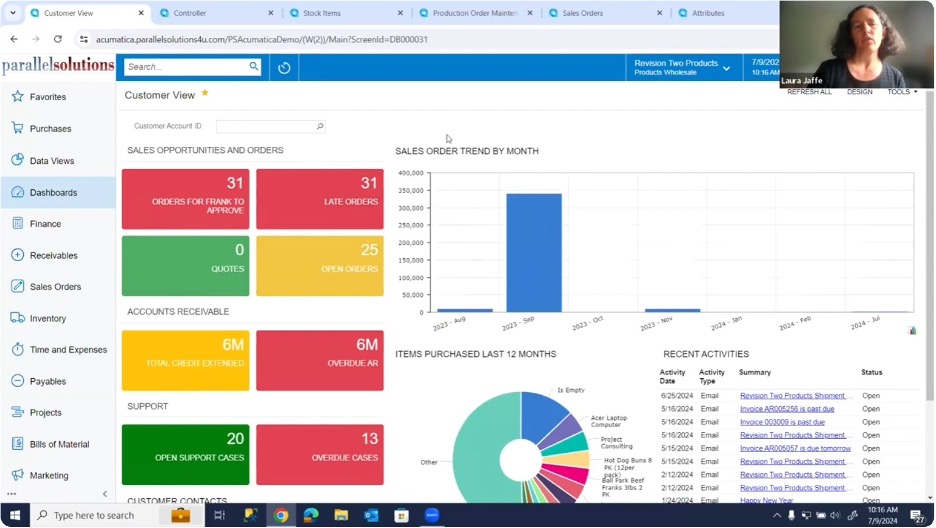
Acumatica’s customer dashboard provides a 360-degree view of any customer relationship — purchase history, sales trends, outstanding orders with ship dates, credit limits and balances, and support activity — all in one place.
When a customer calls about a late order, your sales rep filters to that customer, immediately sees all open orders, identifies the delayed shipment, and provides answers in seconds — no digging through multiple screens. This is what a true single source of truth looks like: sales, inventory, production, and financial data connected in real time.
Acumatica Generic Inquiries: Ad-Hoc Reporting Without IT Support
Generic inquiries are one of Acumatica’s most powerful differentiators. When you click through a dashboard widget, you typically land in a generic inquiry — a live, user-friendly data grid that pulls directly from the database in real time.
Unlike traditional batch reports that reflect yesterday’s data, generic inquiries always show the current state of your business. Acumatica includes hundreds of pre-built inquiries for common questions — overdue customers, low stock items, pending purchase orders, production order status — plus the ability for administrators or power users to build new inquiries without programming.
Visual Indicators and Color Coding: Instant Priority Scanning
Generic inquiries support configurable color highlighting that makes priorities obvious at a glance. In an overdue customers inquiry, for example: red for customers 60+ days overdue or over credit limit, yellow for 30–60 days overdue, and no highlight for current accounts.
The result: scan a list of 50 customers and immediately spot the three that need urgent attention. Color rules are fully configurable based on any data field in the inquiry.
Side Panels: Related Context Without Leaving the Screen
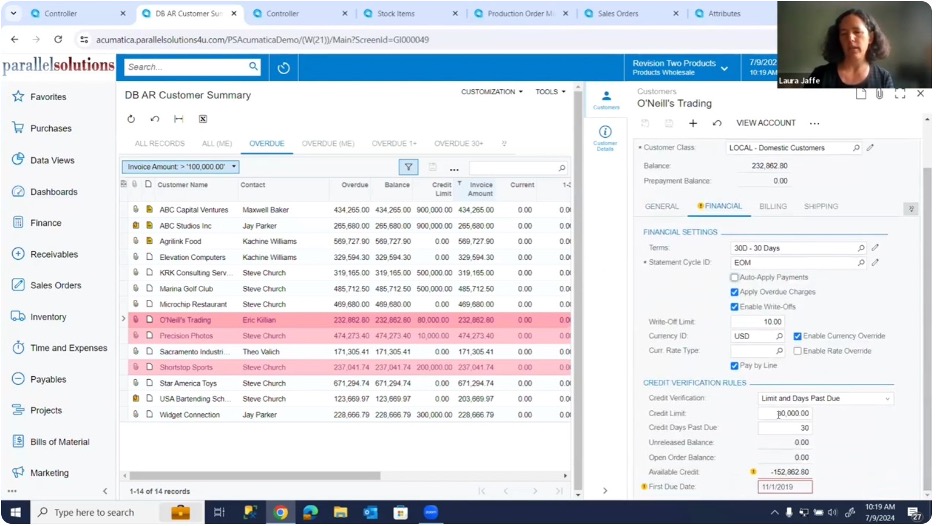
Side panels are one of Acumatica’s most elegant usability features. From within a generic inquiry, you can open a side panel to view related information about any selected row — without navigating away.
In the overdue customers inquiry, open an invoices panel to see all outstanding invoices, a customer detail panel for contact and credit settings, or an orders panel for shipment history. As you click each row, all open side panels refresh automatically. This allows you to rapidly review multiple customers without repetitive back-and-forth navigation.
Side panels work across all inquiry types: inventory (item details and availability), production (order components and routing), and financials (transaction details).
Notes and Attachments: Critical Information That Doesn’t Get Lost
Every row in a generic inquiry supports associated notes and file attachments, indicated by icons in the leftmost column. This is where institutional knowledge lives — a note about a credit hold reason, special shipping instructions, or a preferred vendor.
Notes are visible to all users with appropriate permissions: the warehouse team sees packaging instructions when shipping, purchasing sees vendor preferences when reordering. Context travels with the record, not in someone’s inbox.
Tabs and Saved Views: Instant Access to Your Most Important Filters
Each generic inquiry screen features tabs representing different saved views or filters of the same data. An accounts receivable inquiry might include tabs for all customers, overdue accounts, 30+ days, 60+ days, and customers on credit hold.
Creating a new tab takes about 15 seconds: define the filter criteria, name the tab, and optionally share it with your team or set it as the default view. Tabs are effectively saved searches you can switch between instantly — no re-entering filters each time.
Column Configuration and Personalization: Every User’s Preferred View
Users can rearrange columns by dragging headers, show or hide columns using the column configurator, resize columns, and sort or group data with a click. These personalization settings save automatically per user — the production manager’s view emphasizes quantities while the controller’s highlights financials.
Excel Export: Bridge Between ERP and Spreadsheet Analysis
Every generic inquiry includes a one-click Excel export. The export captures the current view — all active filters, sorting, and visible columns — directly into a spreadsheet. Use it to build mailing lists from customer data, run ABC analysis on inventory, or create custom production charts.
Security settings are respected: users only export data they’re authorized to access.
Integration With Business Processes: From Insight to Action
Dashboards and generic inquiries aren’t passive — they’re integrated into action. From most inquiries, users can navigate directly to transactions, create new records, perform bulk actions, and trigger workflows.
Automated workflows can monitor inquiry results and act accordingly: email alerts when customers exceed credit limits, purchase requisitions when inventory drops below minimums. Dashboards and inquiries become both your information hub and your action center.
Why Real-Time Visibility Matters for Manufacturers
Many traditional ERP systems rely on overnight batch processes to refresh reporting databases. By the time you see the data, decisions have already been made on incomplete information. Acumatica’s dashboards and inquiries always reflect live data.
When production completes an order, inventory updates immediately. When shipping confirms a shipment, customer balances update immediately. When purchasing receives material, availability calculations update immediately. For manufacturers making decisions about production scheduling, material purchasing, and customer commitments — that real-time accuracy is the difference between a good decision and a costly one.
Frequently Asked Questions: Acumatica Dashboards and Generic Inquiries
Can non-technical users create generic inquiries in Acumatica?
Yes. Generic inquiries are designed for power users and administrators to build without programming or IT support. Users select which data fields to display, define filters, and configure how results are presented — all through a guided interface.
How many dashboards does Acumatica include out of the box?
Acumatica ships with dozens of pre-built dashboards tailored to common roles, including purchasing managers, financial controllers, sales representatives, warehouse managers, and production supervisors. All are fully customizable.
Are Acumatica dashboards available on mobile devices?
Yes. Acumatica offers dedicated iOS and Android apps optimized for mobile tasks including reviewing dashboards, approving purchase orders, and checking inventory. The full browser-based interface is also accessible on any mobile browser.
How does Acumatica’s real-time data compare to traditional ERP reporting?
Traditional ERP systems often update reporting databases overnight through batch processes, meaning the data users see can be 12–24 hours old. Acumatica’s generic inquiries pull directly from the live database, so data is always current — updated the moment a transaction is posted.
Can Acumatica dashboards trigger automated workflows?
Yes. Acumatica supports automated workflows driven by inquiry results — for example, automatically sending email alerts when a customer exceeds their credit limit, or generating a purchase requisition when inventory falls below a defined minimum. Dashboards and inquiries serve as both monitoring tools and action triggers.
Key Takeaways
- Acumatica dashboards provide real-time, role-specific business intelligence — no reports to run, no manual data gathering.
- Generic inquiries give manufacturers live access to any business question without IT support or custom development.
- Side panels, color coding, and drill-down capabilities reduce the time to insight from minutes to seconds.
- All data is live — updated the moment a transaction is posted — supporting better decisions at every level of the organization.
- Dashboards and inquiries integrate with workflows, making them action centers as well as information hubs.
Ready to See Acumatica Dashboards in Action?
Effective dashboards and inquiries require understanding what information matters most to your business and how your team needs to access it. Parallel Solutions specializes in helping manufacturers implement and optimize Acumatica — working with you to identify your key performance indicators, critical business questions, and reporting needs, then configuring the dashboards and inquiries that deliver exactly what your team requires.
Contact Parallel Solutions to schedule a conversation about what questions you need answered every day — and how Acumatica can answer them automatically.