
Last Updated: December 8, 2025
In plastic injection molding, waste isn’t just scrap material sitting in bins. It’s lost profit, lost production capacity, and lost competitive advantage. Whether it comes from cycle time inefficiencies, mold quality issues, material degradation, or regrind management problems, waste cuts directly into your margins. Modern visualization tools can change that.
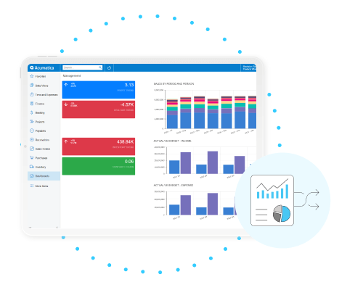
Data visualization, especially through real-time dashboards, is a powerful tool for identifying and reducing waste across plastic injection molding operations. By highlighting patterns in material scrap, quality failures, machine downtime, and process variations, dashboards transform complex production data into actionable insights.
The Data Challenge in Plastic Injection Molding
Plastic injection molding operations generate massive amounts of data: every injection cycle, mold temperature reading, material batch, cavity fill time, and quality inspection adds to the story. But without the right tools, this data stays buried in machine logs, spreadsheets, or disconnected systems. Modern ERP systems designed for plastic injection molding centralize this data, making visualization and analysis possible. But without the right tools, this data stays buried in machine logs, spreadsheets, or disconnected systems. Dashboards bring it to life.
By visualizing key quality and waste metrics, teams can:
- Spot recurring issues by mold, cavity, shift, or material lot
- Track first-shot capability and scrap rate trends
- See material waste and regrind costs in real time
- Monitor cycle time variations that indicate process instability
- Identify mold maintenance needs before catastrophic failure
With this visibility, teams can take proactive action instead of reacting after rejected parts pile up or customer complaints arrive.
Production Quality: The First Line of Defense Against Waste
Production quality is one of the earliest and most visible sources of waste in plastic injection molding. Dashboards that track molding metrics can quickly highlight areas of concern:
|
Metric |
What It Reveals |
| First-Shot Capability | How many parts from startup passed inspection? Poor first-shot rates indicate setup issues, material problems, or mold temperature instability. |
| Scrap Dollars by Mold | Seeing scrap in dollar terms clarifies the financial impact and can be segmented by shift, operator, or material type. |
| Defect Rates by Cavity | Help identify specific cavity problems — wear, venting issues, or gate problems — before they affect the entire production run. |
| PPM Trends by Material Type | Track quality performance across different resins, especially when molding specialized materials like TPE, high-temperature plastics, or bio-based polymers. |
By combining quality metrics with time-based trends, dashboards can pinpoint repeat offenders, whether it’s a particular cavity showing flash, a material lot with inconsistent properties, or a shift pattern indicating operator training gaps. These insights are only possible when your ERP system is purpose-built for plastic injection molding operations, with real-time data integration and customizable dashboards designed for manufacturing teams.
Beyond the Molding Floor: Customer-Facing Quality Metrics
The cost of poor quality doesn’t end when parts leave your press. Dashboards that include Return Material Authorizations (RMAs), customer rejections, and shipment holds provide the complete picture:
- RMA trends by customer or part number reveal which programs carry the highest quality risk
- Reason code analysis helps prioritize process improvements (dimensional issues vs. cosmetic defects vs. material properties)
- Cost of quality by program quantifies the true impact of quality problems, including rework, expedited shipping, and customer goodwill
Visualizing this data helps molding operations shift from firefighting to continuous improvement and ensures that quality improvements drive customer satisfaction, not just internal metrics.
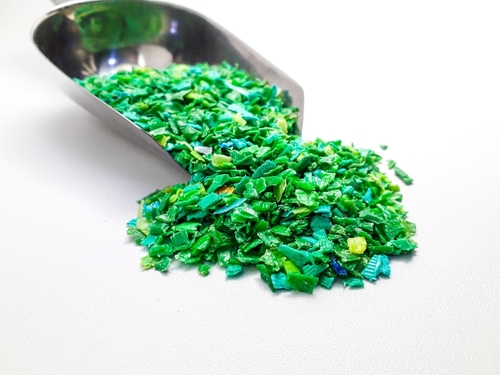
Material Management: The Hidden Profit Leak
In plastic injection molding, material costs typically represent 40-60% of part cost, making material management critical to profitability. Yet material waste often flies under the radar. Dashboards can expose:
| Waste Source | Dashboard Solution |
| Regrind Percentage Drift | Track the actual regrind ratios vs. approved specifications across shifts and machines to prevent quality issues and rejected parts. |
| Material Variance by Work Order | Identify where actual material usage exceeds theoretical — often indicating purge waste, startup scrap, or process instability. |
| Virgin vs. Regrind Cost Impact | Visualize the true cost of quality problems that force virgin-only runs for specialized materials like optical grade plastics, food grade resins, or flame retardant compounds. |
| Material Degradation | Monitor dwell time and temperature exposure, especially critical for moisture-sensitive materials and high-temperature plastics. |
For operations molding specialized materials — conductive polymers, bio-based resins, chemical resistant plastics — where material costs are premium, even small percentage improvements in material efficiency deliver substantial bottom-line impact. Companies like Hedstrom Plastics discovered that integrating their ERP system with visualization tools transformed their operational visibility.
Supplier Performance: Your Extended Molding Operation
Not all waste originates inside your plant. Poor supplier performance in resin delivery, material quality, or colorant consistency can cascade through your entire operation, causing increased scrap, longer setup times, and customer complaints.
Dashboards that track supplier performance over time give you leverage and clarity:
- On-Time Delivery Trends spot suppliers who consistently miss delivery windows, forcing production delays or expensive expedited shipping
- Material Lot Quality monitors incoming inspection results, Certificate of Analysis compliance, and first-article performance by material supplier and lot
- Color Matching Consistency tracks color approval rates and adjustments needed, especially critical for consumer products and optical grade applications
When this data is visualized over time, it becomes easier to support supplier performance reviews, renegotiate contracts, or qualify alternatives based on objective data rather than assumptions.
Process Stability: The Foundation of Lean Molding
Process variation is the enemy of efficient injection molding. Small variations in cycle time, temperature, pressure, or cooling time multiply across thousands of cycles, creating waste through rejected parts, inconsistent dimensions, and unpredictable production rates.
Dashboards help visualize:
- Cycle Time Distribution by mold and shift identifies process instability and opportunities for optimization
- Temperature Variance Patterns highlight zone controller issues, cooling system problems, or mold temperature control failures
- Shot Weight Consistency reveals material delivery problems, check valve wear, or barrel temperature issues
- Machine Downtime Analysis breaks down unplanned stops by cause, machine, and shift to target maintenance improvements
By visualizing where and when process variations occur, injection molding operations can take a targeted approach to root cause analysis and preventive maintenance, rather than accepting variation as “normal.”
 Mold Performance: Protecting Your Critical Assets
Molds represent significant capital investment, and mold problems create some of the most expensive waste in plastic injection molding operations. Dashboards provide visibility into mold health and performance:
- Cycle Count Tracking ensures preventive maintenance occurs before mold failure
- Cavity-by-Cavity Performance identifies wear patterns, venting problems, or water line blockages early
- Setup Time by Mold reveals which tools require excessive setup, indicating alignment issues, damaged components, or operator training needs
- Scrap Rate by Mold highlights problem tools that may need refurbishment or retirement
For operations running multiple material types — from wear-resistant polymers to reinforced plastics to thermoplastic elastomers — understanding how each mold performs with different materials optimizes both tool life and part quality.
Unassigned Inventory: The Forgotten Waste Stream
One of the most overlooked forms of waste in injection molding is unassigned inventory: materials, regrind, or molded parts that exist in the system but aren’t tied to any work order, customer, or location. This leads to confusion, over-ordering, and missed opportunities for reuse.
Dashboards help answer:
- Where is unassigned regrind located? Can it be safely reprocessed?
- Which material lots are expired or approaching expiration? Especially critical for moisture-sensitive resins and high-temperature plastics
- What parts are in “hold” status indefinitely? Can they be reworked or scrapped to free up space?
- How much material is on the floor vs. what’s in the ERP system? Reconciliation prevents costly over-ordering
By tracking and resolving unassigned inventory, injection molding operations improve inventory accuracy, free up valuable floor space, and reduce material costs.
From Insight to Action
Identifying waste is the first step toward eliminating it. But it requires visibility, context, and speed — all of which are made possible by data visualization.
Real-time dashboards help plastic injection molding teams:
- React faster when quality trends drift or process variation increases
- Dig deeper into root causes with drill-down capabilities by machine, mold, shift, operator, and material
- Collaborate better across quality, production, maintenance, and engineering with shared visual data
- Prove value to leadership with clear, quantifiable waste reduction and cost savings
When you can see the waste, you can stop the loss.
Ready to Transform Your Plastic Injection Molding Operation?
Whether you’re injection molding standard commodity resins or specialized materials like conductive polymers, bio-based polymers, or optical grade plastics, data visualization can unlock hidden profit in your operation.
The journey from reactive firefighting to proactive waste elimination starts with visibility. Real-time dashboards transform raw production data into actionable insights that reduce scrap, optimize material usage, improve mold performance, and enhance customer satisfaction.
In an industry where fractions of a second per cycle and fractions of a cent per part matter, data visualization isn’t just a nice-to-have technology; it’s a competitive necessity.
Ready to see how data visualization can reduce waste in your plastic injection molding operation? Let’s talk about turning your production data into your most powerful manufacturing tool.